Cancer Analysis


Introduction:

Cancer is a condition when a few of the body's cells grow out of control and spread to other bodily regions. In the millions of cells that make up the human body, cancer can develop practically anywhere.
Human cells often divide (via a process known as cell growth and multiplication) to create new cells as the body requires them. New cells replace old ones when they die as a result of ageing or damage.

Occasionally, this systematic process fails, causing damaged or abnormal cells to reproduce when they shouldn't. Tumors, which are tissue masses, can develop from these cells.

In this analysis, a thorough investigation of a cancer data collection is conducted. A model has been developed to predict cancer in order to more accurately determine if a person has the disease or not.

Major Libraries investigated during the Analysis of Cancer dataset:
  • Scikit
  • Seaborn
  • Numpy
  • Pandas
  • streamlit
  • Flow of Analysis:

    I looked over the dataset for any missing values after collecting the data.
    I made the decision to divide my analysis into three sections during the analysis inquiry: Anxiety, Overall breakdown, and Breakdown based on Drinking and Smoking.
    I chose to keep my attention just on these three because drinking, smoking, and anxiety have powerful interconnections.
    Later, I used the KNN algorithm to develop a model. Since my dataset was relatively small and KNN performs best with few tuples (records), I chose to use it because it allowed me to predict with a high degree of accuracy.


    Breakdown of Cancer:

    The chart shows that there is not much of a difference between men and women who have cancer; both groups are close together.

    Cause of this behaviour:

  • Unhealthy eating patterns
  • Processed foods
  • Additives in food
  • Chemical pollution
  • Constipation
  • Usage of synthetic hormones and pesticides in farming and animal husbandry
  • Poor and stressful lifestyle
  • Extended working hours
  • Air we breathe
  • Smoking and Drinking
  • Longer life expectancy that causes our bodies to make more mistakes since we are exposed to more diseases as we age


  • Anxiety Analysis:

    The graph shows that the age group 60 - 70 comprises the greatest number of persons, followed by those present in 50 - 60 and then those in 70 - 80.
    According to the dataset, anxiety is directly correlated with the population size of a given age group, with persons in the 60 - 70 age range experiencing the most anxiety.


    Alcohol and Smoking and their relationship to Cancer:

    Two key conclusions may be drawn from the graph:

  • People who drink have higher Cancer risk than those who smoke.

  • It can be argued that practically everyone who Smokes and Drinks has cancer.


  • KNN Model:

    Model Code:

    X = data.iloc[:,2:15]##independent features
    y = data.iloc[:,15]##dependent features
    X_train, X_test, y_train, y_test = train_test_split(X, y, test_size=0.2, random_state=12)
    #feature Scaling
    X_train = preprocessing.StandardScaler().fit(X_train).transform(X_train)
    X_test = preprocessing.StandardScaler().fit(X_test).transform(X_test)
    #Model Creation
    classifier = KNeighborsClassifier(n_neighbors=8, weights = 'uniform', metric='euclidean').fit(X_train,y_train)
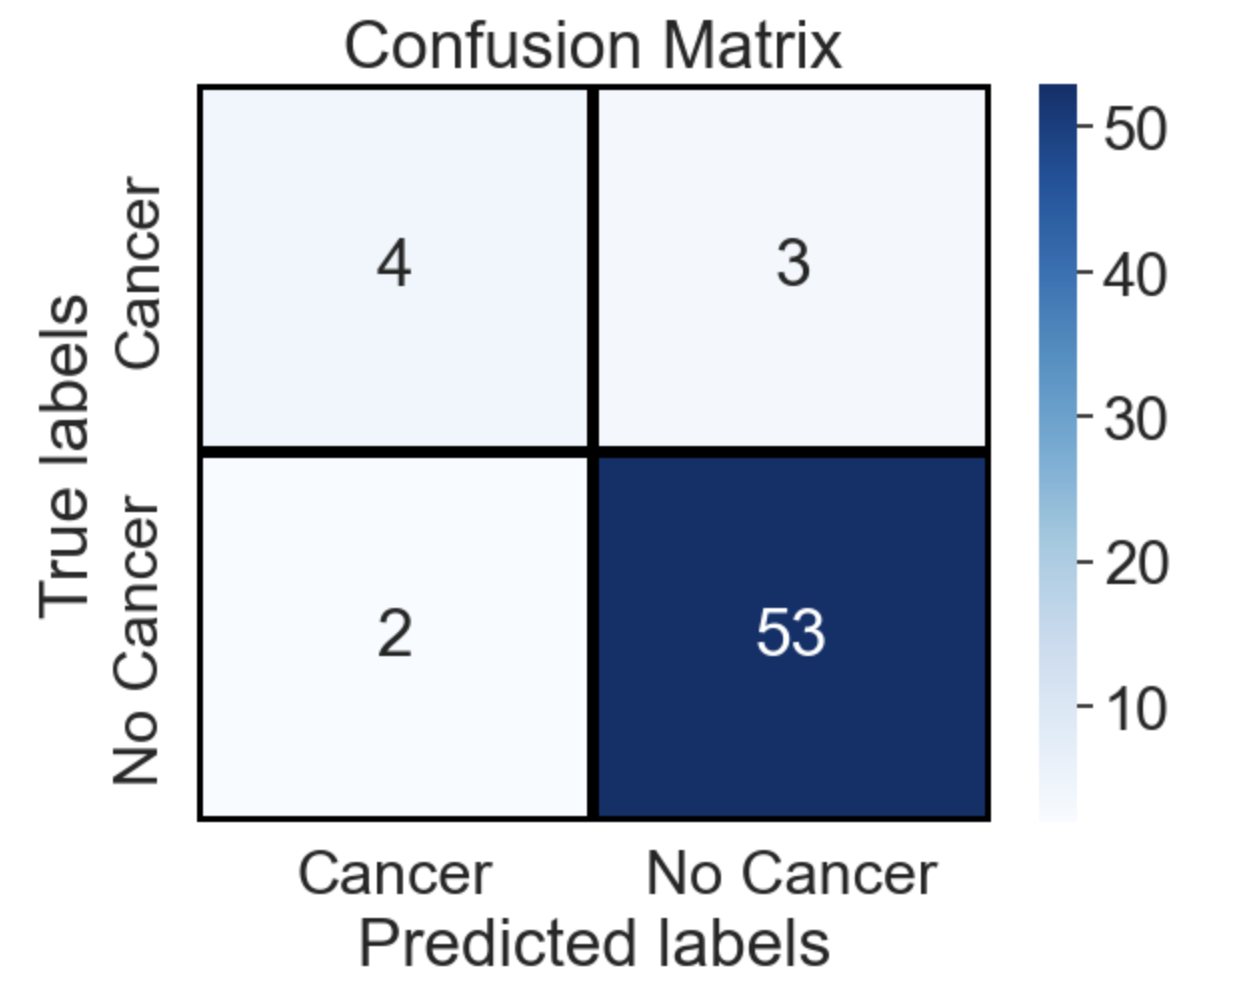
    alternative

    Accuracy of Model: 91.93548387096774 %

    F-Score of Model: 95.49549549549549 %

    Author's Note:
    There are numerous strategies to either avoid cancer or lessen the harm it causes.
    The greatest method is to maintain good health by putting an emphasis on healthy behaviours and engage in regular exercise.
    A healthy body serves as a barrier to prevent illness. The more we practise these activities, the less likely we are to get diseases, enabling us to live longer without stress.
    Being optimistic also plays a crucial part in our health.

     Links: