Titanic Analysis
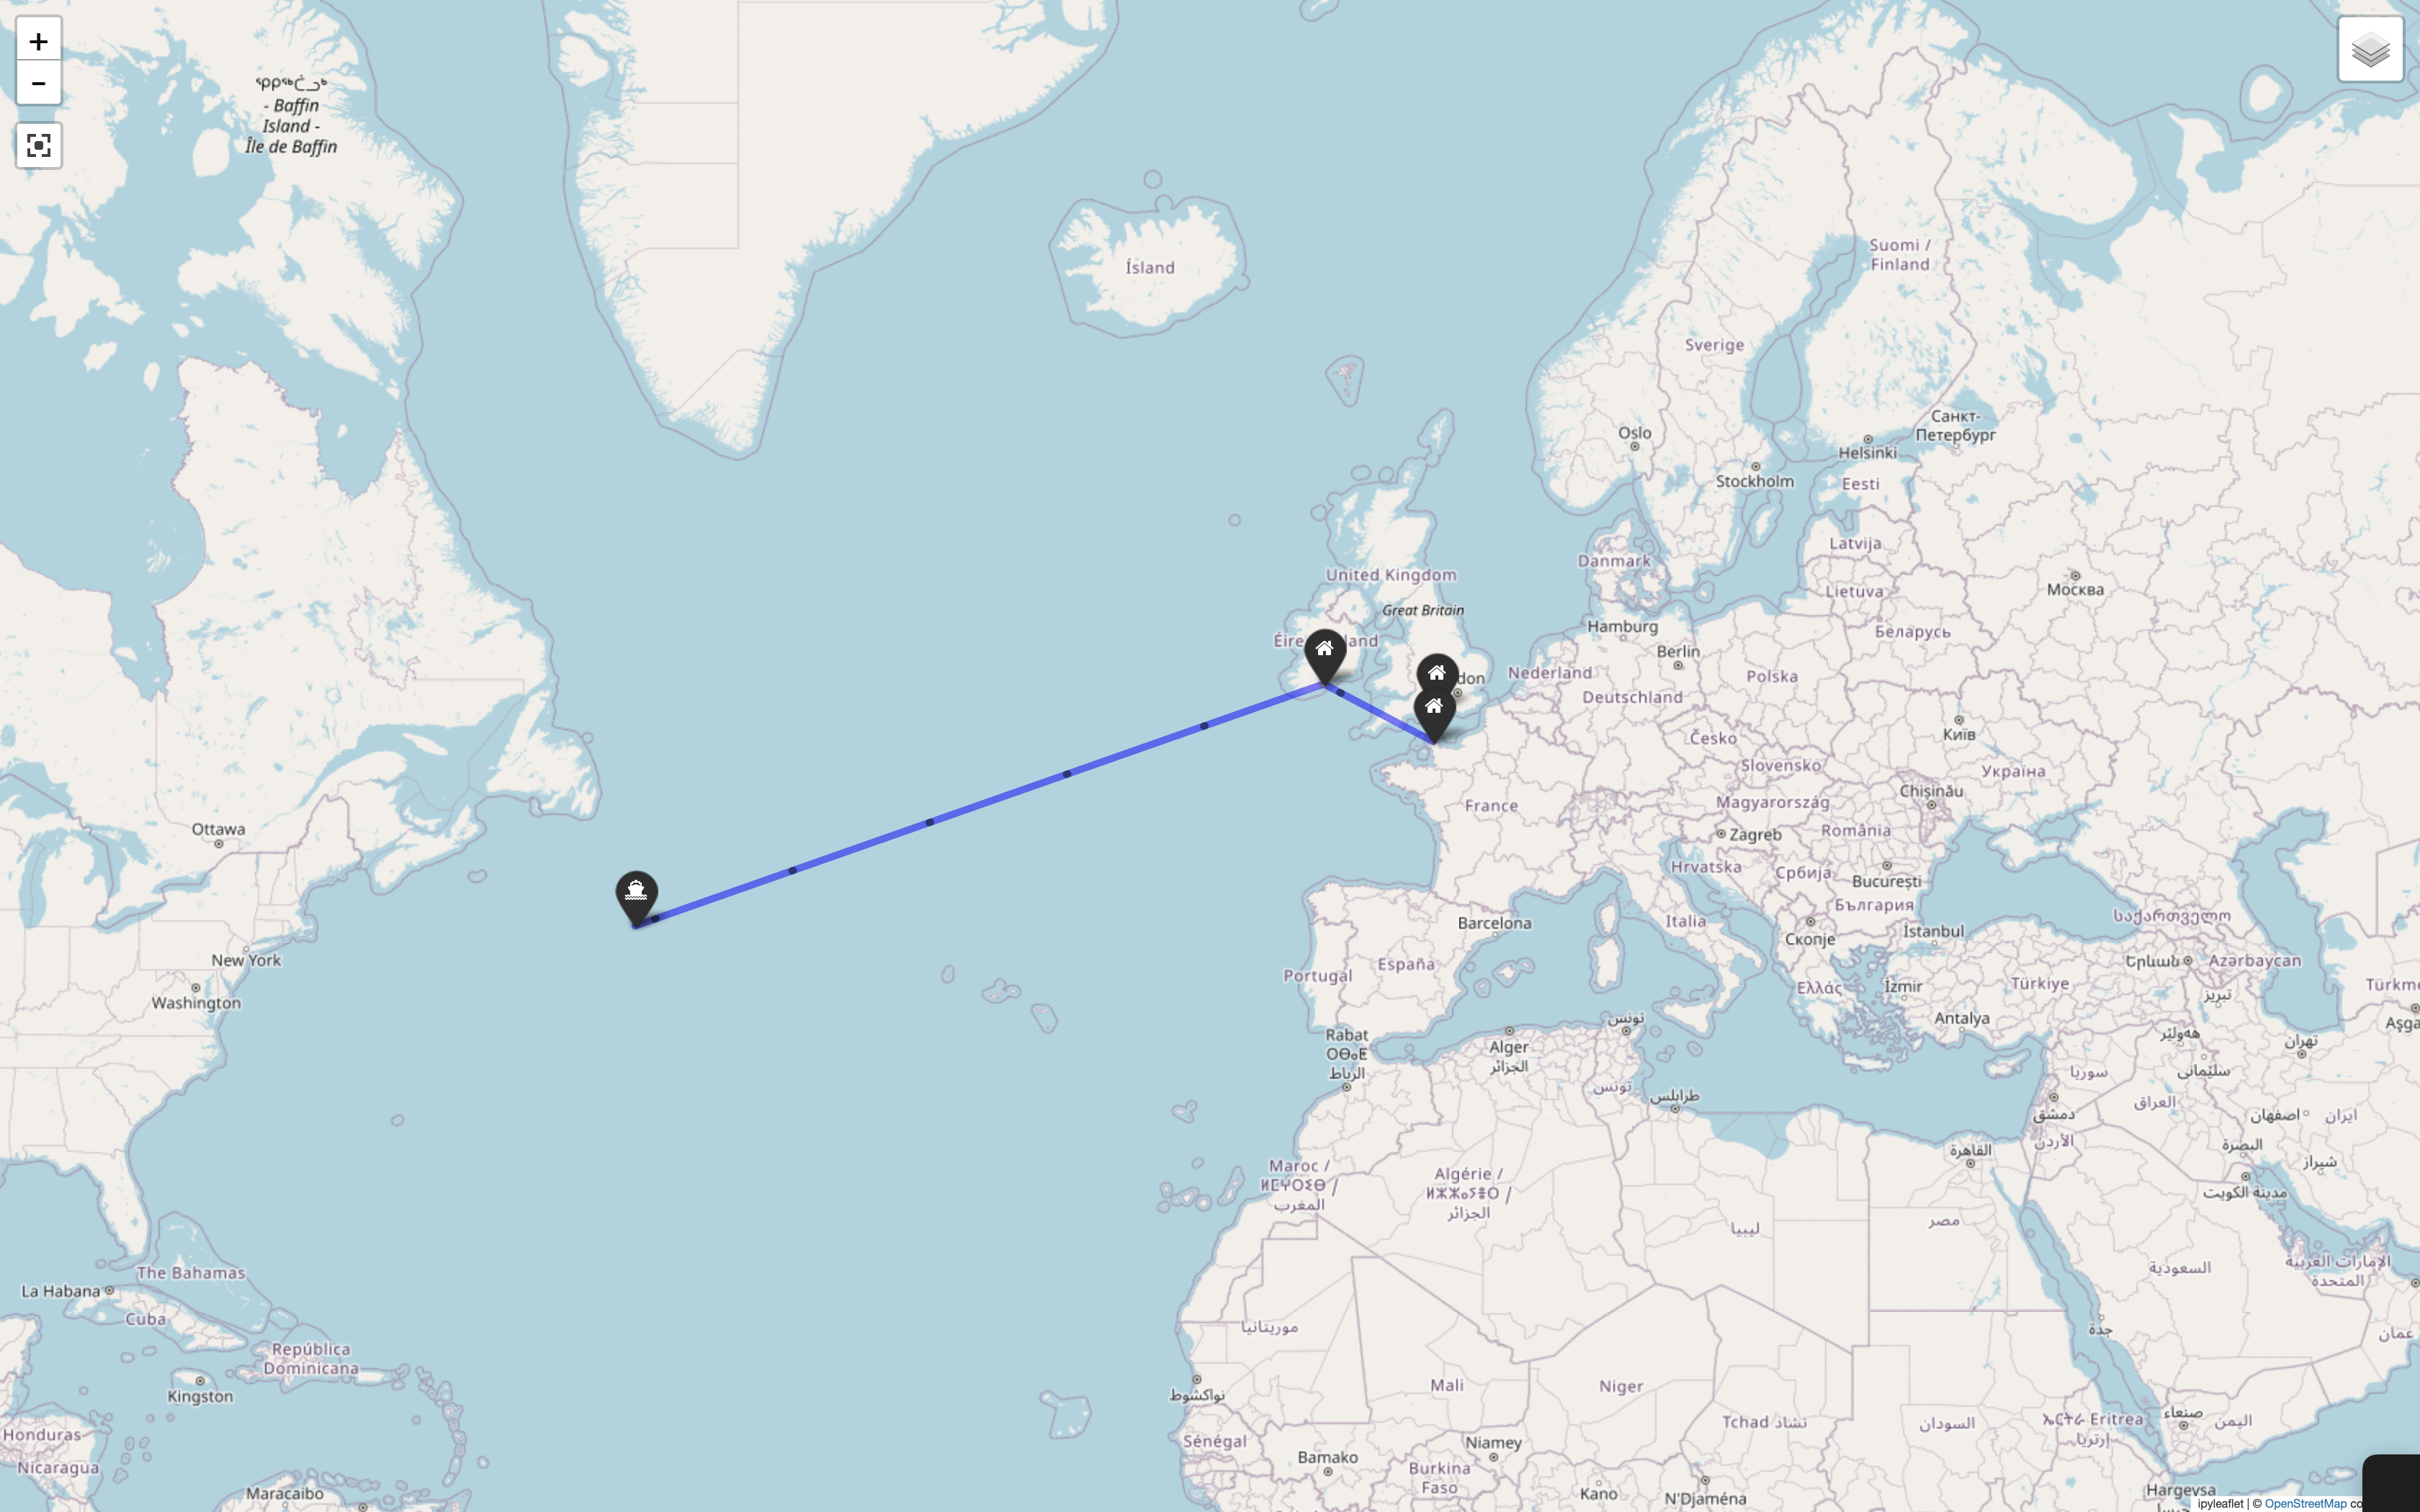
The RMS Titanic was a British liner operated by White Star Line. Titanic perished in the North Atlantic Ocean after colliding with an iceberg on her maiden voyage from Southampton, England, to New York City, United States, on April 15, 1912.
The sinking of RMS Titanic is regarded the deadliest peacetime cruise ship sinking.
In this dashboard, an in-depth study of the RMS Titanic dataset from Kaggle is performed.
Major Libraries
Flow of Analysis
After acquiring the data, I reviewed the dataset for any missing values. Once those were dealt with completely, the analysis was divided into three parts: city-wise, survival-wise, and revenue-wise. Finally, a small chart of the Titanic's route was created. Matplotlib was the library relied on heavily - its ability to generate numerous charts enabled analysis from various angles. Streamlit significantly supported matplotlib in building the dashboard.
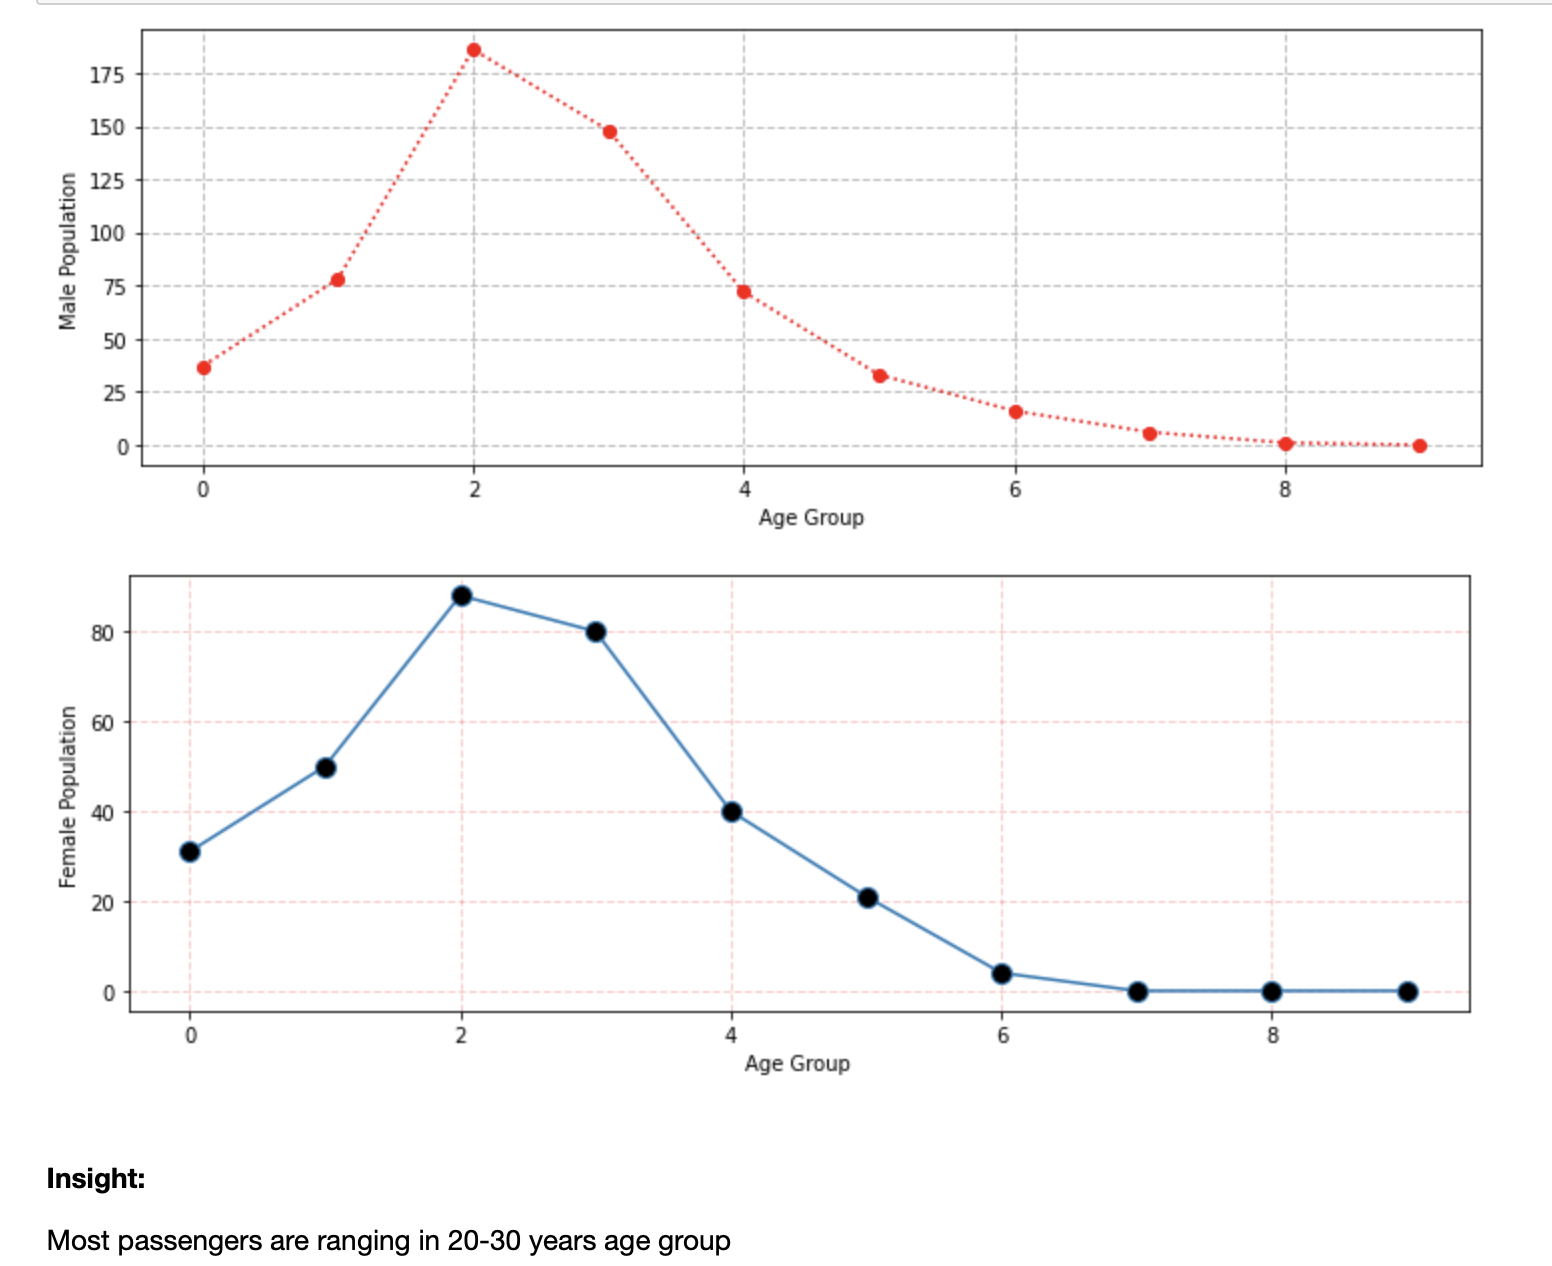
Insights derived from the aforementioned dashboard
The number of males who boarded the ship outnumbers the number of females.
Maximum number of passengers aboard the ship from Southampton city.
Revenue generated by males and females is almost equal.
Glimpse of Kaggle